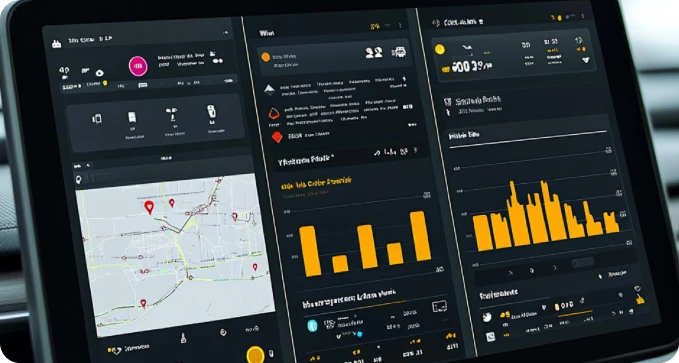
Siloed data
Data sits in separate systems, CRM, ERP, spreadsheets, and teams work from different versions of the truth. We help unify your data sources into a single, consistent view.
Bring your data together into a trusted source of truth, with intuitive dashboards and insights that help teams make better decisions, faster.
Trusted By
750+ happy clients, including top Fortune 500 companies













Overview
Business Intelligence (BI) services refer to the technology, processes and consulting that help organisations collect, organise, analyse and visualise their business data.
BI solutions typically include dashboards, reporting tools, data integration pipelines and analytics platforms, all designed to help decision-makers understand what is happening in their business and why.
Unlike raw data analysis, BI is focused on making information accessible and actionable for business users. In short, BI services help businesses replace guesswork with evidence.
What We Solve
Many organisations recognise that data exists across their systems but struggle to make it useful. Sphinx Solutions addresses the following pain points.
Data sits in separate systems, CRM, ERP, spreadsheets, and teams work from different versions of the truth. We help unify your data sources into a single, consistent view.
Teams spend hours every week pulling reports by hand. We automate reporting so your people focus on analysis, not data collection.
Leadership lacks a real-time view of sales, operations or financial performance. We build dashboards that give decision-makers the visibility they need, when they need it.
Decisions are delayed because the right information is hard to find. We reduce the time from question to answer, so your business moves faster.
Different departments report different numbers for the same KPI. We establish a governed, shared data layer so everyone works from the same source.
Tell us where the numbers break down and we’ll map the shortest route to a single source of truth.
What We Build
From strategy and dashboards to data integration and performance analytics, we deliver end-to-end Business Intelligence services that turn your data into clear, actionable insight.
01
We start with an assessment of your current data environment, reporting needs and business goals. Our BI consultants help you define the right strategy, select appropriate tools, and prioritise implementation based on business impact. Whether you are starting from scratch or improving an existing setup, we provide practical guidance, not just technology.
Talk to our service experts02
We design and build interactive dashboards that give your teams an at-a-glance view of key performance metrics. Dashboards are tailored to specific roles, whether for a CFO tracking financial KPIs or an operations manager monitoring delivery performance.
Talk to our service experts03
Raw numbers rarely drive decisions. We transform your data into clear visual formats, such as charts, graphs, heatmaps and trend lines that communicate patterns and anomalies quickly and accurately.
Talk to our service experts04
We build automated, scheduled reports that replace manual exports and email-based reporting. Reports are delivered in the format your teams prefer: web dashboards, PDF exports or Excel integrations.
Talk to our service experts05
We connect your existing data sources, databases, cloud applications, spreadsheets and third-party APIs into a unified data pipeline. This ensures your BI layer is always working from complete, up-to-date information.
Talk to our service experts06
We help you track the KPIs that actually matter to your business: revenue, operational efficiency, customer acquisition and more. We also set up alerting and benchmarking so you know when performance drifts from target.
Talk to our service expertsBenefits
See the bigger picture, act on the right insights and drive better business outcomes with data you can trust.
When the right data is available at the right time, decisions happen faster and with greater confidence. BI removes the delay between question and answer.
Consolidating data from multiple systems into one governed layer eliminates conflicting reports and ensures consistent metrics across departments.
Automation of reporting workflows reduces manual effort, freeing teams to focus on analysis and action rather than data preparation.
Leaders and managers gain a clear view of what is performing and what is not across departments, geographies or product lines.
Rather than discovering problems after the fact, BI enables teams to spot trends and anomalies early, before they become costly.
By understanding your own performance data clearly, you are better positioned to respond to market changes and outperform competitors.
Expertise
Three platforms carry most of the work. Which one fits depends on your existing stack, your licensing and who inside the business will be building the reports.
Tableau is the most popular software tool used in Business Intelligence (BI) companies for data exploration and visualisation. It has many features, such as data blending, ad hoc analysis and data. Our team of professionals has expertise in using the Tableau platform for Business Intelligence.
Power BI is a Business Intelligence and data visualisation tool developed by Microsoft. It has many functionalities, such as data accessibility, Excel integration, interactive and custom visualisation. Our Business Intelligence team has proficiency in utilising Power BI to help businesses make data-driven decisions.
Qlik is one of the top business intelligence and data analytics tools in the market. It has many key elements, like self-service reporting, interactive dashboards, and search & conversational analytics. We have a team of skilled experts who use Qlik to uncover key insights and help businesses make smart decisions.
Industries
Business Intelligence is relevant across nearly every sector. Here are the industries we have experience working with.
How We Build It
At Sphinx Solutions, we leverage modern Business Intelligence technologies and analytics platforms to help organisations transform raw data into meaningful business insights. Our technology ecosystem enables seamless data integration, advanced visualisation and reliable reporting at scale.
How We Work
Our Business Intelligence development process follows a structured and collaborative approach designed to transform raw business data into actionable insights. From understanding your reporting challenges to deploying intuitive dashboards, every stage focuses on delivering accurate, scalable and business-ready BI solutions.
Step 1
What we do: We begin by understanding your business objectives, existing reporting processes, key stakeholders, KPIs and current data challenges. This helps us define the scope and align the BI strategy with your business goals.
What you get
Step 2
What we do: Our team evaluates your existing data sources, data quality, accessibility, consistency and completeness. We identify potential gaps and assess the readiness of your data ecosystem.
What you get
Step 3
What we do: Based on your business requirements and technical environment, we design a suitable BI architecture, select the right tools, and define the data flow strategy.
What you get
Step 4
What we do: We integrate multiple data sources, build ETL pipelines, and create structured data models that provide a reliable foundation for reporting and analytics.
What you get
Step 5
What we do: Our BI experts design interactive dashboards, reports and visualisations tailored to your business needs while incorporating stakeholder feedback throughout the development process.
What you get
Step 6
What we do: We validate data accuracy, dashboard functionality, report performance and overall usability to ensure the insights generated are reliable and actionable.
What you get
Step 7
What we do: Once approved, we deploy the BI solution within your environment and provide training, documentation and guidance to ensure smooth adoption.
What you get
Step 8
What we do: After deployment, we provide ongoing support, performance monitoring, dashboard enhancements and additional reporting capabilities as your business evolves.
What you get
Comparison
Although the terms Business Intelligence and Business Analytics are often used interchangeably, they serve different business objectives. Business Intelligence primarily focuses on understanding past and current business performance, while Business Analytics helps organisations predict future trends and make strategic decisions using advanced analysis techniques.
| Factor | Business Intelligence (BI) | Business Analytics (BA) |
|---|---|---|
| Primary focus | Answers “What happened?” by analysing historical and current business data. | Answers “Why did it happen?” and “What may happen next?” through deeper analysis. |
| Data type | Primarily uses historical and real-time operational data. | Uses historical, real-time and predictive data models. |
| Business goal | Monitor business performance and improve operational efficiency. | Forecast future outcomes and support long-term strategy. |
| Analysis type | Descriptive and diagnostic analysis. | Predictive and prescriptive analysis. |
| Outputs | Dashboards, reports, scorecards and KPIs. | Forecasts, statistical models, simulations and recommendations. |
| Users | Executives, managers, department heads and business users. | Data analysts, data scientists and strategy teams. |
| Decision support | Supports day-to-day operational decisions. | Supports strategic and future-focused decisions. |
| Tools commonly used | Power BI, Tableau, Looker, Qlik Sense. | Python, R, SAS, machine learning platforms and advanced analytics tools. |
| Complexity level | Easier for business users to adopt and interpret. | Requires analytical expertise and specialised skills. |
| Example use case | Monitoring monthly sales performance through dashboards. | Predicting future customer demand or sales trends. |
If your organisation wants to understand current performance, monitor KPIs and improve operational visibility, Business Intelligence is the ideal starting point.
If your goal is to forecast trends, predict customer behaviour or build data-driven strategies, Business Analytics provides more advanced capabilities.
How We Engage
Every organisation’s data landscape is different. Whether you need a one-time dashboard implementation, ongoing analytics support or a dedicated BI team, our flexible engagement models help you choose the right level of involvement, investment and scalability.
A well-defined scope, predictable budget and milestone-based delivery make this model ideal for organisations with clearly defined reporting requirements, dashboard projects, proof of concepts or data visualisation initiatives.
For organisations with evolving reporting requirements, shifting business goals or expanding analytics needs, our agile engagement model enables continuous improvement and iterative delivery.
Extend your internal capabilities with a dedicated team of BI consultants, data analysts and dashboard developers who work closely with your stakeholders and business teams.
Book a 30-minute BI consultation.
Expert Insights
One of the biggest mistakes organisations make with Business Intelligence is building dashboards before understanding the questions they need answered. Successful BI isn’t about producing more reports, it’s about identifying the right metrics, designing for a single source of truth, and building governance from day one. When done correctly, Business Intelligence becomes a long-term business transformation tool, not just a reporting solution.
Why Choose Us
Sphinx has completed 16 successful years in the industry, helping businesses with technology and digital transformation, including AI-powered solutions across major industry verticals.
We have a dedicated and reliable team of AI engineers, ML scientists, data engineers, and MLOps specialists covering every role in the AI development lifecycle.
We have delivered more than 1,500 solutions through a results-driven approach, many to recurring clients who keep expanding their AI capabilities with us.
We have a dedicated in-house team, experienced and skilled across AI development, software engineering, QA, DevOps, and cloud infrastructure.
We are trusted by 750+ clients for best-in-class AI solutions at competitive rates, with the delivery accountability enterprise clients demand.
Our client-centric approach and high-calibre AI engineering, built on current models and frameworks, have made us a trusted partner for businesses building AI.
Get real-time visibility into your operations, automate reporting and empower your teams with actionable insights.
Connect with us
Tell us which numbers you cannot see today and we’ll come back with a dashboard plan, the data sources it needs and a timeline.
Everything you need to know about putting a Business Intelligence layer in place. Can’t find your answer? Talk to us.
ERP systems collect, organise and centralise business data from various departments to streamline operations. Business Intelligence software analyses that data using reporting, analytics and visualisation tools to uncover trends and support decision-making. In simple terms, ERP manages operational data, while BI transforms that data into actionable business insights.
BI implementation typically includes data integration, data management, warehousing, dashboard development, analytics configuration and reporting setup. Each implementation is tailored to the organisation’s specific business goals, data sources and reporting requirements to ensure accurate insights and maximise the return on BI investments.
Self-service Business Intelligence allows employees to access, analyse and visualise data without relying heavily on IT teams or data specialists. It enables business users to create reports, monitor KPIs and gain insights independently, improving decision-making speed, collaboration and overall organisational agility.
Business Intelligence helps organisations analyse customer behaviour, monitor competitors, track performance metrics and identify emerging market trends. By providing real-time insights and data-driven recommendations, BI enables businesses to make informed decisions, improve operational efficiency, respond quickly to market changes and stay ahead of competitors.
Yes. Our BI support services include maintaining and optimising existing dashboards, reports, ETL processes, databases and analytics systems. We help organisations improve performance, resolve issues, enhance reporting capabilities and reduce operational costs while extending the value of their current Business Intelligence investments.
Yes. Modern Business Intelligence platforms can connect to live data sources and deliver real-time dashboards that continuously update business metrics. This enables organisations to monitor KPIs, track operational performance, identify issues quickly and make faster, data-driven decisions based on the latest available information.
The implementation timeline depends on factors such as data complexity, integrations, reporting requirements and business objectives. Smaller BI projects may take a few weeks, while enterprise-wide implementations involving multiple data sources, dashboards and analytics capabilities can require several months to complete successfully.